
Have you wished you could plot numbers in a table on a real map; and not use map picture. Also, this infographic thus created should dynamically refresh based on data. There is a very easy way to do this, even for a complete non-techie without having to fiddle with geo-coding, latitudes and longitudes.
Install the Bing Map add-in for Excel from the office store:
https://store.office.com/app.aspx?assetid=WA102957661
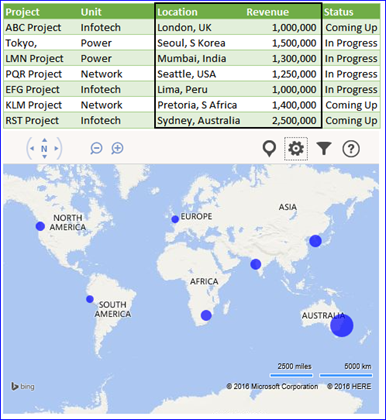
Step 1: Create a table with the required data. Note the location column text should contain a city or country name (or both). For example, “Paris” will show in France by default. But with “Paris, CA” you can plot the same named city in California.
Step 2: Click in cell where you want the map. Go to Insert -> My Apps (in Add-ins group) -> Click on Bing Maps (this option appears if you have installed the add-in). First time it will ask if you want to “Insert Sample Data”. Cancel this.
Step 3: Click on the Filter icon of the add-in (top right). Click on “Select data…” link that appears the bottom right of the pop-up. Now you can select the required cells. VERY IMPORTANT that the location column is the first column of your selection. The other included columns can only contain numbers. Also, include column headers (see example). That’s it; changing data will auto-refresh the map.
You can use settings (Gear icon) to further refine how your map looks. The add-in box can be sized and moved using handles, just like a regular chart. You can have multiple maps on the same sheet.
Two basic options for data plot are, “Pie Chart” for multiple number columns and “Circles” for single number column (bigger the number larger the circle). Pie chart is useful to show multiple numbers; in this example if you add a “Profit” column, you would get mini pie-charts for Revenue and Profit figures for all location (of same size).
Here is another example using pie-chart option.
Another option is to view as “Bird’s Eye” or “Road”. You can customize the pin colors. Map zoom is determined by extent of pins spread across the map, you can also zoom in/out.
Tip: You can also cut-paste the generated static image to other applications (Word, PowerPoint, etc.)
